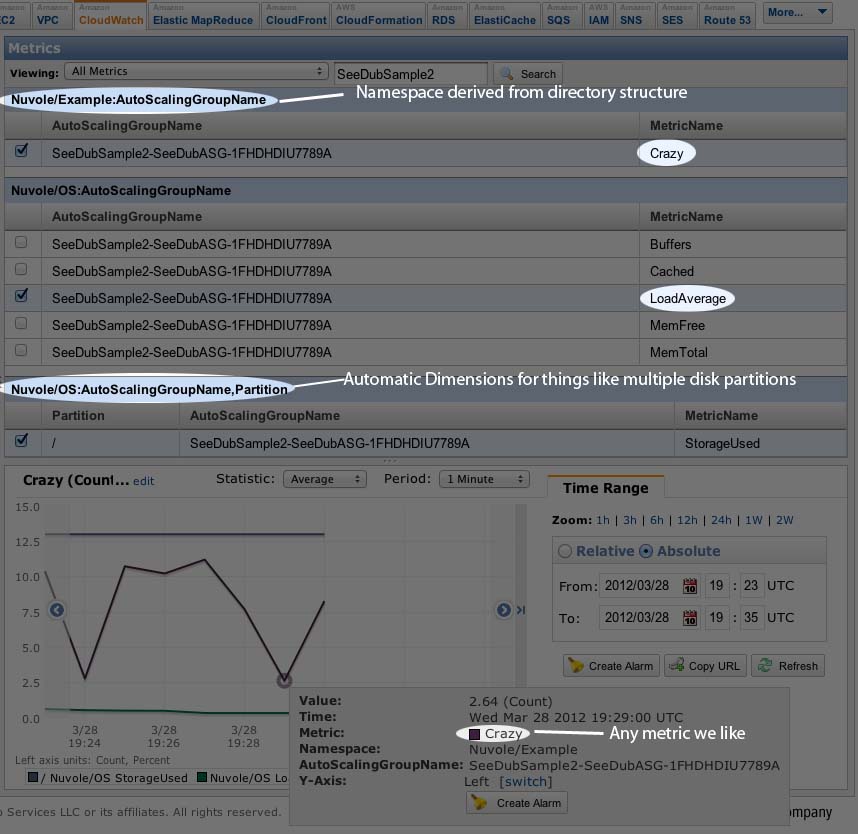
When AWS supported an API call to push whatever metric we want, we got very excited. Once a metric is in CloudWatch, we can key a scaling policy to it, have it trigger an action, an alarm, basically perform any action we very well please. Finally, ultimate flexibility in what factors determine what actions, and we get pretty graphs to boot! For example, we could scale a processing group up and down like an accordion based on the number of entries in a DB table, or maybe the amount of free system memory. The hurdles proved disheartening, but we created a solution.
Take for instance API throttling, the shadowy world where AWS can never give a straight answer. Actually, they can, but you have to escalate. All the API endpoints have limits on them, per-customer. You can raise them, but your code has to be able to throttle itself or you risk crazy race conditions everywhere, especially when you’re talking about thousands of machines all pushing their metrics via, say, cron every five minutes.
The CloudWatch team, under NDA, provided me with a development library in perl that would handle API retries, but we wanted one solution we could deploy everywhere and not worry. So we wrote SeeDub, an intermediary that takes simple files and queues them up for batch processing by the Amazon::CloudWatchClient lib, which will handle all the retries. Built-in is some randomness for an offset to make sure thousands of machines aren’t firing all at once. Write a file into /var/nuvole/seedub.d/NAMESPACE/unique_name_for_metric_file, and let bin/putmetricdata.pl take care of CloudWatch, e.g.
$ cat > /var/nuvole/seedub.d/Nuvole/SpecialNamespace/whatever.random1384y28237 <
value 15
unit Count
time 1314639962
dimensions Partition=/
EOF
$ bin/putmetricdata.pl us-east-1
Any app, any system tool, any piddly script that can write four simple lines has direct, robust and resilient access to the CloudWatch API regardless of your limit.
And recently, the CloudWatch team has released an updated version of the code, which seems perfectly compatible. And so we're releasing our part. https://github.com/netbas/SeeDub/
For those who want to see it in action on their own machines immediately, create a stack using the SeeDub sample CloudFormation template, which launches a fully operational stack with SeeDub pushing metrics for an autoscaling group of two t1.micros. Feed it your KeyName as a param, and with one button you'll have actionable metrics with pretty graphs like the above within fifteen minutes. Via the command-line:
cfn-create-stack SeeDubSample2 -f seedub.iam.json --capabilities CAPABILITY_IAM --parameters "KeyName=bingo"
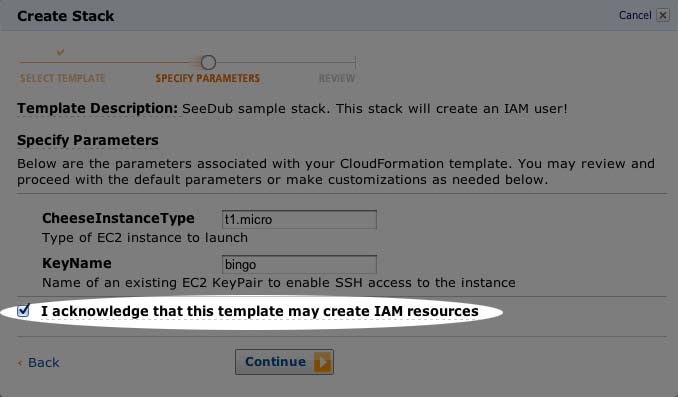
NOTE: If you launch this CloudFormation stack via the AWS Management Console, you must check the little box that says it's ok to create an IAM user, which is dangerous even if we claim to follow the principle of least privilege, like so:
NOTE: it also uses EeSeeToo, another of our packages which so far acts solely to provide an instance with the name of its autoscaling group (ASG).


